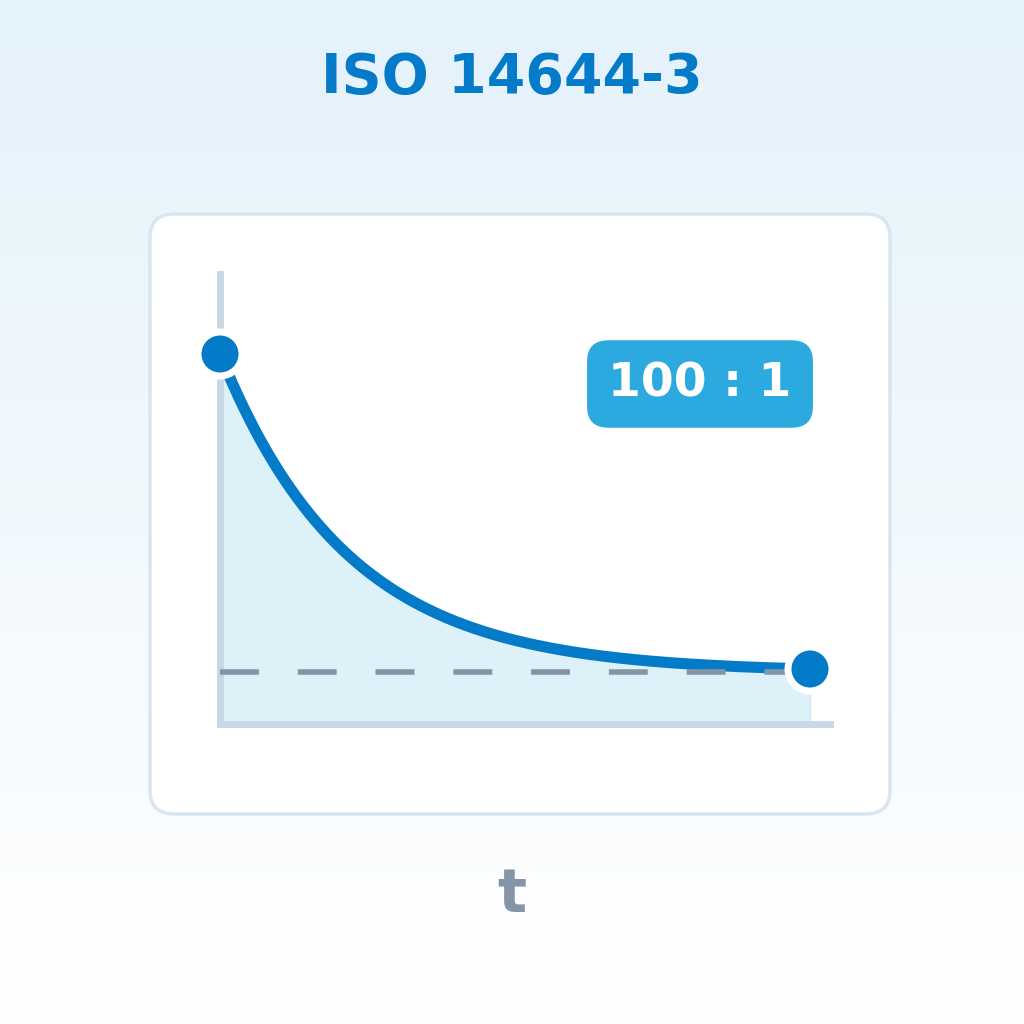
Recovery Time Is the Performance Proof of the Air Handling System
Classification and filter leakage testing describe a state. Recovery time, by contrast, describes a behaviour: how quickly does the installation return the room to the required level of cleanliness after a disturbance? It is one of the few tests that makes the dynamic performance of ventilation and filtration directly visible – and one of the most telling indicators when an installation degrades over the years.
The Procedure According to ISO 14644-3
ISO 14644-3 describes the recovery test as a decay experiment. In all variants the sequence follows the same pattern:
- Establish the initial concentration: A test aerosol is used to raise the particle concentration in the room to roughly one hundred times the target value.
- Measure the decay: Once aerosol generation stops, the concentration is measured continuously at a defined position in a fixed time grid until the target value is reached again.
- Evaluate: The result is the 100:1 recovery time – the time taken to fall to one hundredth of the initial concentration.
- Observe the scope: The procedure is intended for non-unidirectional airflow. In unidirectional areas it makes no technical sense, because there is no mixed ventilation with a decaying concentration.
Typical Pitfalls
Most unusable recovery measurements fail because of the test setup, not the room: an initial concentration that exceeds the particle counter measuring range and causes coincidence errors without a suitable dilution stage; a probe position too close to the aerosol source or inside the supply air jet; a time grid too coarse to represent the decay; and documentation that in the end only shows the result, not the curve it is based on.
Recovery Time or Clean-up Period?
Both figures are often mentioned in the same breath, yet they do not mean the same thing. Recovery time under ISO 14644-3 is based on an artificially introduced disturbance and demonstrates installation performance. The clean-up period under EU GMP Annex 1 starts when actual activity in the room ends and demonstrates that the at-rest condition is regained in time. We have compiled the detailed comparison on a dedicated page: Clean-up Period vs. Recovery Time.
How Moqlero Supports the Measurement
Recovery and clean-up are dedicated measurement types in Moqlero, each with its own procedure and acceptance criteria. The decay measurement runs automatically as a sequence on the instrument, individual values are captured with a timestamp and evaluated as a curve. Repeat measurements can be triggered for individual installations without repeating the entire test set, and the trend type for recovery times makes gradual deterioration visible across several campaigns.
Measure recovery time properly and you spot installation problems before they turn into deviations!