Data Intelligence: Insights from the Dashboard.
Data is the foundation of modern decision-making. Our dashboard delivers more than just numbers—it provides valuable insights into process stability and efficiency of cleanroom monitoring.
Global Metrics & Capacity
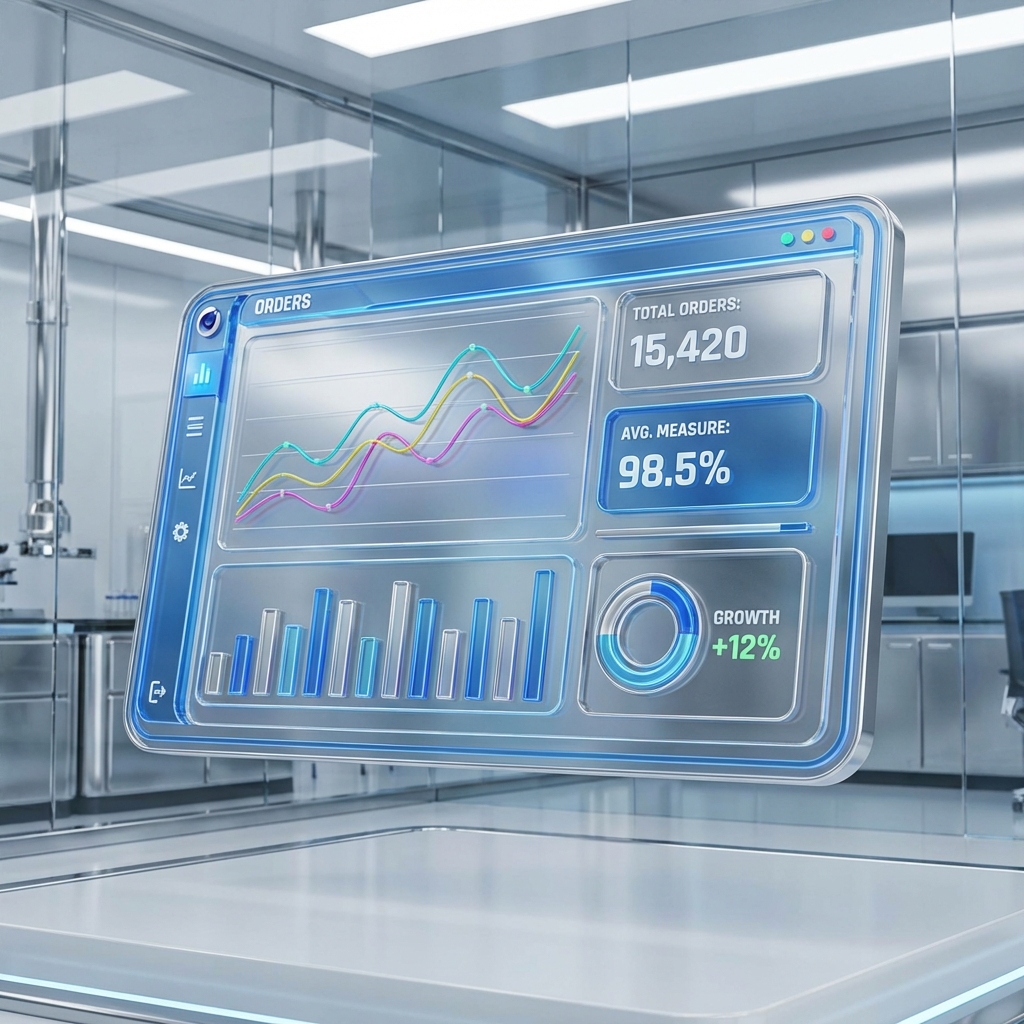
The Moqlero statistics dashboard visualizes the total volume of all measurements conducted, enabling precise capacity planning. Seasonal peaks are made transparent through detailed sub-evaluations per month, year, and total period.
Method Mix & Prediction
The distribution of all 14 measurement types is broken down in detail: Filtertest, Recovery, Laminar Flow Maintenance, Particle Monitoring: Room in Operation, Particle Monitoring: UAF in Operation, Particle Classification: Room at Rest, Particle Classification: UAF at Rest, Particle Gas, Zero Measurement, Clean-Up Test, Activity, Physical Environment, Air Exchange Rate, and Airflow Direction / Smoke Test. Additionally, linear extrapolation of measurement counts enables a well-founded forecast of future workloads.
Distinction from Trend Reports
While this dashboard provides operational metrics (quantities, types), detailed qualitative evaluations (e.g., long-term particle trends or recovery times) can be found in the dedicated Trend Analysis module. Six trend types are available: Filter Efficiency, Filter Differential Pressure, Particle Counts, Physical Environment, Air Volume Measurement, and Air Exchange Rate. Both views complement each other for complete process control.
Harness the power of your data – for optimized processes and informed decisions.